••
Menu
CodingVox
CodingVox
In today's digital world, businesses rely on dashboards to track performance, manage orders, and analyze data. A well-designed dashboard provides valuable insights at a glance and improves decision-making. In this post, we’ll walk you through how to create a responsive dashboard using HTML, CSS, and JavaScript. This dashboard will include a sidebar menu, interactive charts, and real-time statistics, making it perfect for eCommerce, sales tracking, or business analytics.
Many developers choose HTML, CSS, and JavaScript to build dashboards because these technologies offer flexibility, responsiveness, and easy integration with APIs. Here’s why they’re a great choice:
With just these three technologies, you can create a fully functional admin panel without relying on complex frameworks.
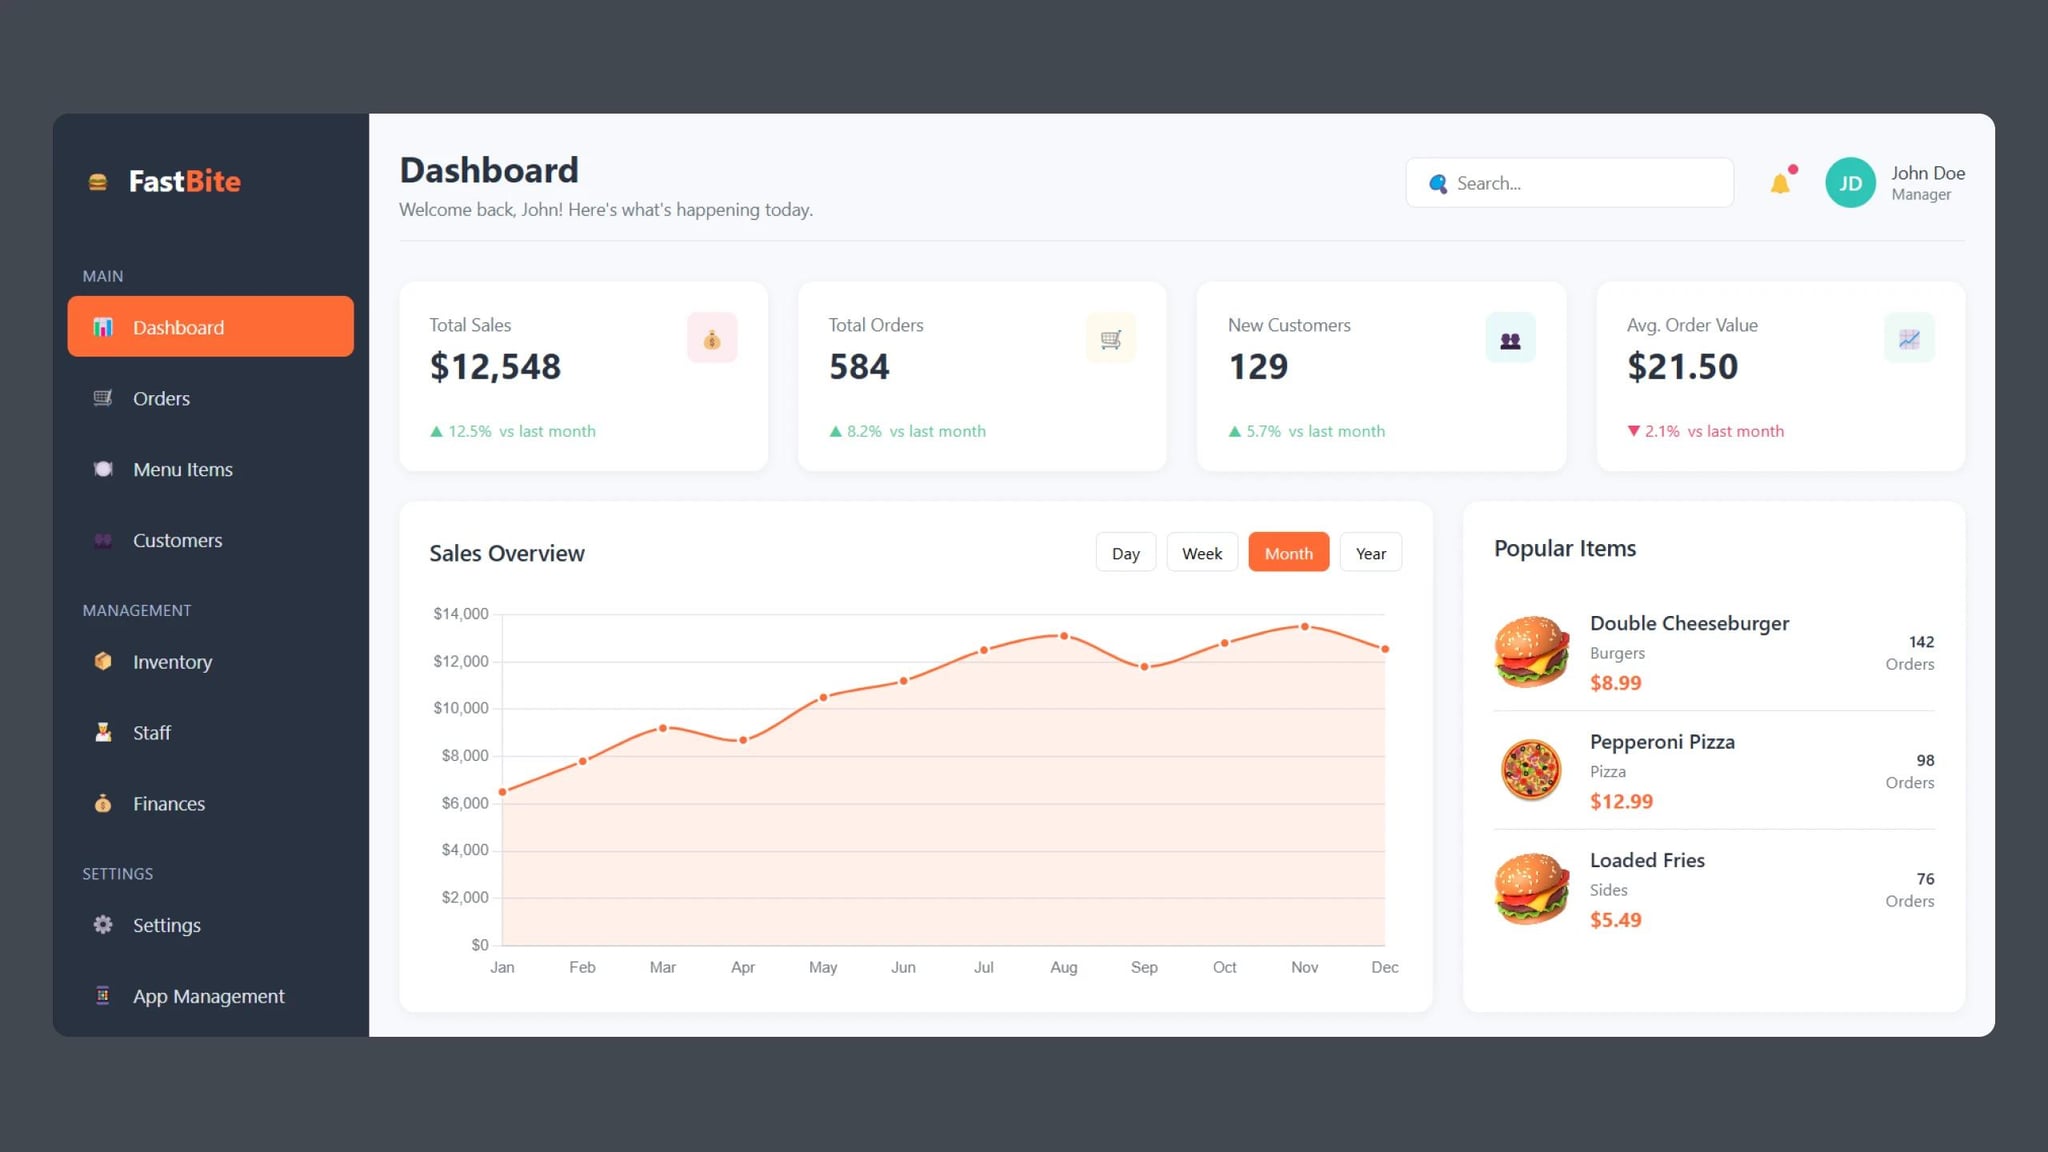
This dashboard includes essential features such as:
Each of these elements ensures the dashboard is user-friendly, interactive, and data-driven.
The sidebar menu helps users navigate between different sections, such as orders, menu items, and finances. The dashboard header includes a search bar for quick filtering and a notification bell for alerts. The main section presents sales figures using easy-to-read statistics cards. Additionally, charts and tables provide real-time data visualization, making it easier for users to track trends.
JavaScript plays a vital role in making the dashboard dynamic and interactive. It powers the:
By integrating JavaScript, the dashboard responds instantly to user interactions without requiring page reloads.
A dashboard must be responsive to work on different devices, including desktops, tablets, and smartphones. Using CSS media queries, the layout adapts smoothly to various screen sizes. A responsive dashboard ensures:
A web-based dashboard is a powerful tool for businesses. Here are some key advantages:
Whether you’re running an eCommerce store, a restaurant, or a SaaS business, a well-designed dashboard improves workflow efficiency.
<!DOCTYPE html><html lang="en"><head><meta charset="UTF-8" /><meta name="viewport" content="width=device-width, initial-scale=1.0" /><title>FastBite Dashboard</title><script src="https://cdnjs.cloudflare.com/ajax/libs/Chart.js/3.9.1/chart.min.js"></script><link rel="stylesheet" href="style.css" /></head><body><!-- Sidebar --><div class="sidebar"><div class="sidebar-brand"><div class="icon">🍔</div><h2>Fast<span>Bite</span></h2></div><div class="sidebar-menu"><div class="menu-category">Main</div><ul><li><a href="#" class="active"><div class="icon">📊</div>Dashboard</a></li><li><a href="#"><div class="icon">🛒</div>Orders</a></li><li><a href="#"><div class="icon">🍽️</div>Menu Items</a></li><li><a href="#"><div class="icon">👥</div>Customers</a></li></ul><div class="menu-category">Management</div><ul><li><a href="#"><div class="icon">📦</div>Inventory</a></li><li><a href="#"><div class="icon">👨🍳</div>Staff</a></li><li><a href="#"><div class="icon">💰</div>Finances</a></li></ul><div class="menu-category">Settings</div><ul><li><a href="#"><div class="icon">⚙️</div>Settings</a></li><li><a href="#"><div class="icon">📱</div>App Management</a></li><li><a href="#"><div class="icon">📊</div>Analytics</a></li></ul></div></div><!-- Main Content --><div class="main-content"><!-- Header --><div class="header"><div class="page-title"><h1>Dashboard</h1><div class="page-subtitle">Welcome back, John! Here's what's happening today.</div></div><div class="header-actions"><div class="search-box"><i>🔍</i><input type="text" placeholder="Search..." /></div><div class="notification-bell"><div class="icon">🔔</div><div class="notification-dot"></div></div><div class="user-profile"><div class="avatar">JD</div><div class="user-info"><div class="name">John Doe</div><div class="role">Manager</div></div></div></div></div><!-- Stats Cards --><div class="stats-cards"><div class="stat-card"><div class="stat-card-header"><div><div class="stat-card-title">Total Sales</div><div class="stat-card-value">$12,548</div></div><div class="stat-card-icon sales">💰</div></div><div class="stat-card-trend trend-up"><span>▲ 12.5%</span> vs last month</div></div><div class="stat-card"><div class="stat-card-header"><div><div class="stat-card-title">Total Orders</div><div class="stat-card-value">584</div></div><div class="stat-card-icon orders">🛒</div></div><div class="stat-card-trend trend-up"><span>▲ 8.2%</span> vs last month</div></div><div class="stat-card"><div class="stat-card-header"><div><div class="stat-card-title">New Customers</div><div class="stat-card-value">129</div></div><div class="stat-card-icon customers">👥</div></div><div class="stat-card-trend trend-up"><span>▲ 5.7%</span> vs last month</div></div><div class="stat-card"><div class="stat-card-header"><div><div class="stat-card-title">Avg. Order Value</div><div class="stat-card-value">$21.50</div></div><div class="stat-card-icon revenue">📈</div></div><div class="stat-card-trend trend-down"><span>▼ 2.1%</span> vs last month</div></div></div><!-- Dashboard Grid --><div class="dashboard-grid"><!-- Sales Chart Section --><div class="sales-chart"><div class="card-header"><div class="card-title">Sales Overview</div><div class="time-filter"><button class="filter-btn">Day</button><button class="filter-btn">Week</button><button class="filter-btn active">Month</button><button class="filter-btn">Year</button></div></div><div class="chart-container"><canvas id="salesChart"></canvas></div></div><!-- Popular Items Section --><div class="popular-items"><div class="card-header"><div class="card-title">Popular Items</div></div><div class="item-card"><img src="./images/burger.jpg" alt="Burger" class="item-image" /><div class="item-details"><div class="item-name">Double Cheeseburger</div><div class="item-category">Burgers</div><div class="item-price">$8.99</div></div><div class="item-sales"><div class="sales-count">142</div><div>Orders</div></div></div><div class="item-card"><img src="./images/pizza.jpg" alt="Pizza" class="item-image" /><div class="item-details"><div class="item-name">Pepperoni Pizza</div><div class="item-category">Pizza</div><div class="item-price">$12.99</div></div><div class="item-sales"><div class="sales-count">98</div><div>Orders</div></div></div><div class="item-card"><img src="./images/burger.jpg" alt="Fries" class="item-image" /><div class="item-details"><div class="item-name">Loaded Fries</div><div class="item-category">Sides</div><div class="item-price">$5.49</div></div><div class="item-sales"><div class="sales-count">76</div><div>Orders</div></div></div></div><!-- Recent Orders Section --><div class="recent-orders"><div class="card-header"><div class="card-title">Recent Orders</div></div><table class="orders-table"><thead><tr><th>Order ID</th><th>Customer</th><th>Items</th><th>Date</th><th>Total</th><th>Status</th></tr></thead><tbody><tr><td class="order-id">#FB2854</td><td>Emily Johnson</td><td>Double Cheeseburger, Fries (L), Soda</td><td>Mar 8, 2025 - 12:42 PM</td><td>$15.97</td><td><span class="order-status status-completed">Completed</span></td></tr><tr><td class="order-id">#FB2853</td><td>Michael Smith</td><td>Pepperoni Pizza, Buffalo Wings, Garlic Bread</td><td>Mar 8, 2025 - 12:35 PM</td><td>$24.98</td><td><span class="order-status status-preparing">Preparing</span></td></tr><tr><td class="order-id">#FB2852</td><td>Sarah Williams</td><td>Caesar Salad, Grilled Chicken Wrap</td><td>Mar 8, 2025 - 12:28 PM</td><td>$16.48</td><td><span class="order-status status-completed">Completed</span></td></tr><tr><td class="order-id">#FB2851</td><td>David Brown</td><td>Fish & Chips, Lemonade</td><td>Mar 8, 2025 - 12:15 PM</td><td>$14.49</td><td><span class="order-status status-cancelled">Cancelled</span></td></tr><tr><td class="order-id">#FB2850</td><td>Jessica Davis</td><td>Veggie Burger, Sweet Potato Fries, Milkshake</td><td>Mar 8, 2025 - 12:03 PM</td><td>$18.47</td><td><span class="order-status status-completed">Completed</span></td></tr></tbody></table><div class="view-more"><button class="view-more-btn">View All Orders</button></div></div></div></div><script src="script.js"></script></body></html>
:root {--primary: #ff6b35;--secondary: #2ec4b6;--dark: #293241;--light: #f7f9fc;--grey: #e0e6ed;--success: #57cc99;--warning: #ffd166;--danger: #ef476f;}* {margin: 0;padding: 0;box-sizing: border-box;font-family: "Segoe UI", Tahoma, Geneva, Verdana, sans-serif;}body {background-color: var(--light);display: flex;min-height: 100vh;color: var(--dark);}/* Sidebar Styles */.sidebar {width: 250px;background-color: var(--dark);color: white;padding: 20px 0;height: 100vh;position: fixed;top: 0;left: 0;bottom: 0;transition: all 0.3s ease;}.sidebar-brand {padding: 16px 24px;display: flex;align-items: center;gap: 12px;margin-bottom: 20px;}.sidebar-brand h2 {font-weight: 700;font-size: 24px;}.sidebar-brand span {color: var(--primary);}.sidebar-menu {padding: 0 12px;}.menu-category {font-size: 12px;text-transform: uppercase;color: #a9b8d5;padding: 16px 12px 8px;letter-spacing: 0.5px;}.sidebar-menu ul {list-style: none;}.sidebar-menu li {margin-bottom: 8px;}.sidebar-menu a {display: flex;align-items: center;padding: 12px 16px;color: #e0e6ed;text-decoration: none;border-radius: 8px;transition: all 0.2s ease;gap: 12px;font-size: 15px;}.sidebar-menu a:hover {background-color: rgba(255, 255, 255, 0.1);color: white;}.sidebar-menu a.active {background-color: var(--primary);color: white;}.icon {display: inline-block;width: 24px;height: 24px;line-height: 24px;text-align: center;}/* Main Content Styles */.main-content {flex: 1;margin-left: 250px;padding: 24px;}/* Header Styles */.header {display: flex;justify-content: space-between;align-items: center;margin-bottom: 32px;padding-bottom: 16px;border-bottom: 1px solid var(--grey);}.page-title h1 {font-size: 28px;font-weight: 700;}.page-subtitle {font-size: 14px;color: #6c757d;margin-top: 4px;}.header-actions {display: flex;align-items: center;gap: 24px;}.search-box {position: relative;}.search-box input {padding: 10px 16px 10px 40px;border: 1px solid var(--grey);border-radius: 8px;background-color: white;width: 260px;font-size: 14px;outline: none;transition: all 0.2s;}.search-box input:focus {border-color: var(--primary);box-shadow: 0 0 0 3px rgba(255, 107, 53, 0.1);}.search-box i {position: absolute;left: 14px;top: 50%;transform: translateY(-50%);color: #6c757d;}.notification-bell {position: relative;cursor: pointer;}.notification-dot {position: absolute;top: -2px;right: -2px;width: 8px;height: 8px;background-color: var(--danger);border-radius: 50%;}.user-profile {display: flex;align-items: center;gap: 12px;cursor: pointer;}.avatar {width: 40px;height: 40px;background-color: var(--secondary);border-radius: 50%;display: flex;align-items: center;justify-content: center;color: white;font-weight: 600;}.user-info {font-size: 14px;}.user-info .role {font-size: 12px;color: #6c757d;}/* Dashboard Grid Layout */.dashboard-grid {display: grid;grid-template-columns: repeat(12, 1fr);gap: 24px;}/* Stats Cards */.stats-cards {grid-column: span 12;display: grid;grid-template-columns: repeat(4, 1fr);gap: 24px;margin-bottom: 24px;}.stat-card {background-color: white;border-radius: 12px;padding: 24px;box-shadow: 0 2px 8px rgba(0, 0, 0, 0.05);display: flex;flex-direction: column;}.stat-card-header {display: flex;justify-content: space-between;align-items: flex-start;margin-bottom: 16px;}.stat-card-title {font-size: 14px;color: #6c757d;margin-bottom: 4px;}.stat-card-icon {width: 40px;height: 40px;border-radius: 8px;display: flex;align-items: center;justify-content: center;color: white;}.stat-card-icon.sales {background-color: rgba(239, 71, 111, 0.1);color: var(--danger);}.stat-card-icon.orders {background-color: rgba(255, 209, 102, 0.1);color: var(--warning);}.stat-card-icon.customers {background-color: rgba(46, 196, 182, 0.1);color: var(--secondary);}.stat-card-icon.revenue {background-color: rgba(87, 204, 153, 0.1);color: var(--success);}.stat-card-value {font-size: 28px;font-weight: 700;margin-bottom: 8px;}.stat-card-trend {display: flex;align-items: center;font-size: 13px;gap: 6px;}.trend-up {color: var(--success);}.trend-down {color: var(--danger);}/* Chart and Popular Items Sections */.sales-chart {grid-column: span 8;background-color: white;border-radius: 12px;padding: 24px;box-shadow: 0 2px 8px rgba(0, 0, 0, 0.05);margin-bottom: 24px;}.card-header {display: flex;justify-content: space-between;align-items: center;margin-bottom: 24px;}.card-title {font-size: 18px;font-weight: 600;}.time-filter {display: flex;gap: 8px;}.filter-btn {padding: 6px 12px;font-size: 13px;border: 1px solid var(--grey);border-radius: 6px;background-color: white;cursor: pointer;transition: all 0.2s;}.filter-btn:hover {border-color: var(--primary);color: var(--primary);}.filter-btn.active {background-color: var(--primary);border-color: var(--primary);color: white;}.chart-container {height: 300px;}.popular-items {grid-column: span 4;background-color: white;border-radius: 12px;padding: 24px;box-shadow: 0 2px 8px rgba(0, 0, 0, 0.05);margin-bottom: 24px;}.item-card {display: flex;align-items: center;gap: 16px;padding: 12px 0;border-bottom: 1px solid var(--grey);}.item-card:last-child {border-bottom: none;}.item-image {width: 60px;height: 60px;border-radius: 8px;object-fit: cover;}.item-details {flex: 1;}.item-name {font-weight: 600;margin-bottom: 4px;}.item-category {font-size: 13px;color: #6c757d;margin-bottom: 4px;}.item-price {font-weight: 700;color: var(--primary);}.item-sales {font-size: 13px;color: #6c757d;display: flex;flex-direction: column;align-items: flex-end;}.sales-count {font-weight: 600;color: var(--dark);}/* Recent Orders Section */.recent-orders {grid-column: span 12;background-color: white;border-radius: 12px;padding: 24px;box-shadow: 0 2px 8px rgba(0, 0, 0, 0.05);}.orders-table {width: 100%;border-collapse: collapse;margin-top: 16px;}.orders-table th {text-align: left;padding: 12px 16px;border-bottom: 1px solid var(--grey);font-weight: 600;color: #6c757d;font-size: 14px;}.orders-table td {padding: 16px;border-bottom: 1px solid var(--grey);font-size: 14px;}.orders-table tr:last-child td {border-bottom: none;}.order-id {font-weight: 600;color: var(--primary);}.order-status {padding: 6px 12px;border-radius: 6px;font-size: 12px;font-weight: 600;display: inline-block;}.status-completed {background-color: rgba(87, 204, 153, 0.1);color: var(--success);}.status-preparing {background-color: rgba(255, 209, 102, 0.1);color: var(--warning);}.status-cancelled {background-color: rgba(239, 71, 111, 0.1);color: var(--danger);}.view-more {display: flex;justify-content: center;margin-top: 24px;}.view-more-btn {padding: 10px 24px;font-size: 14px;border: 1px solid var(--primary);border-radius: 8px;background-color: white;color: var(--primary);cursor: pointer;transition: all 0.2s;}.view-more-btn:hover {background-color: var(--primary);color: white;}
const ctx = document.getElementById("salesChart").getContext("2d");const salesChart = new Chart(ctx, {type: "line",data: {labels: ["Jan","Feb","Mar","Apr","May","Jun","Jul","Aug","Sep","Oct","Nov","Dec",],datasets: [{label: "Sales ($)",data: [6500, 7800, 9200, 8700, 10500, 11200, 12500, 13100, 11800, 12800,13500, 12548,],backgroundColor: "rgba(255, 107, 53, 0.1)",borderColor: "#FF6B35",borderWidth: 2,tension: 0.3,pointBackgroundColor: "#FF6B35",pointBorderColor: "#fff",pointBorderWidth: 2,pointRadius: 4,pointHoverRadius: 6,fill: true,},],},options: {responsive: true,maintainAspectRatio: false,plugins: {legend: {display: false,},tooltip: {backgroundColor: "#293241",titleColor: "#fff",bodyColor: "#fff",padding: 12,displayColors: false,callbacks: {label: function (context) {return `$${context.parsed.y.toLocaleString()}`;},},},},scales: {x: {grid: {display: false,},ticks: {color: "#6C757D",},},y: {beginAtZero: true,grid: {color: "#E0E6ED",},ticks: {color: "#6C757D",callback: function (value) {return "$" + value.toLocaleString();},},},},},});// Add interactivity to the filter buttonsconst filterBtns = document.querySelectorAll(".filter-btn");filterBtns.forEach((btn) => {btn.addEventListener("click", () => {filterBtns.forEach((b) => b.classList.remove("active"));btn.classList.add("active");});});
Building a responsive dashboard with HTML, CSS, and JavaScript is a great way to manage business operations efficiently. With an intuitive UI, real-time analytics, and responsive design, this dashboard can streamline processes and improve user experience. Start developing your own admin panel today and take your business to the next level!
If you found this guide helpful, share it with others and explore more tutorials on building interactive web applications.
Developer
Join 1,000+ developers getting weekly web development tips and code snippets
Found this helpful? Share it with others!